Precious Metals Market Analysis July 2026

GoldMarket SilverMarket PreciousMetals MarketAnalysis InvestmentStrategy Macroeconomics

Summary

Mind Map Cover Image
AI Generated Cover Image

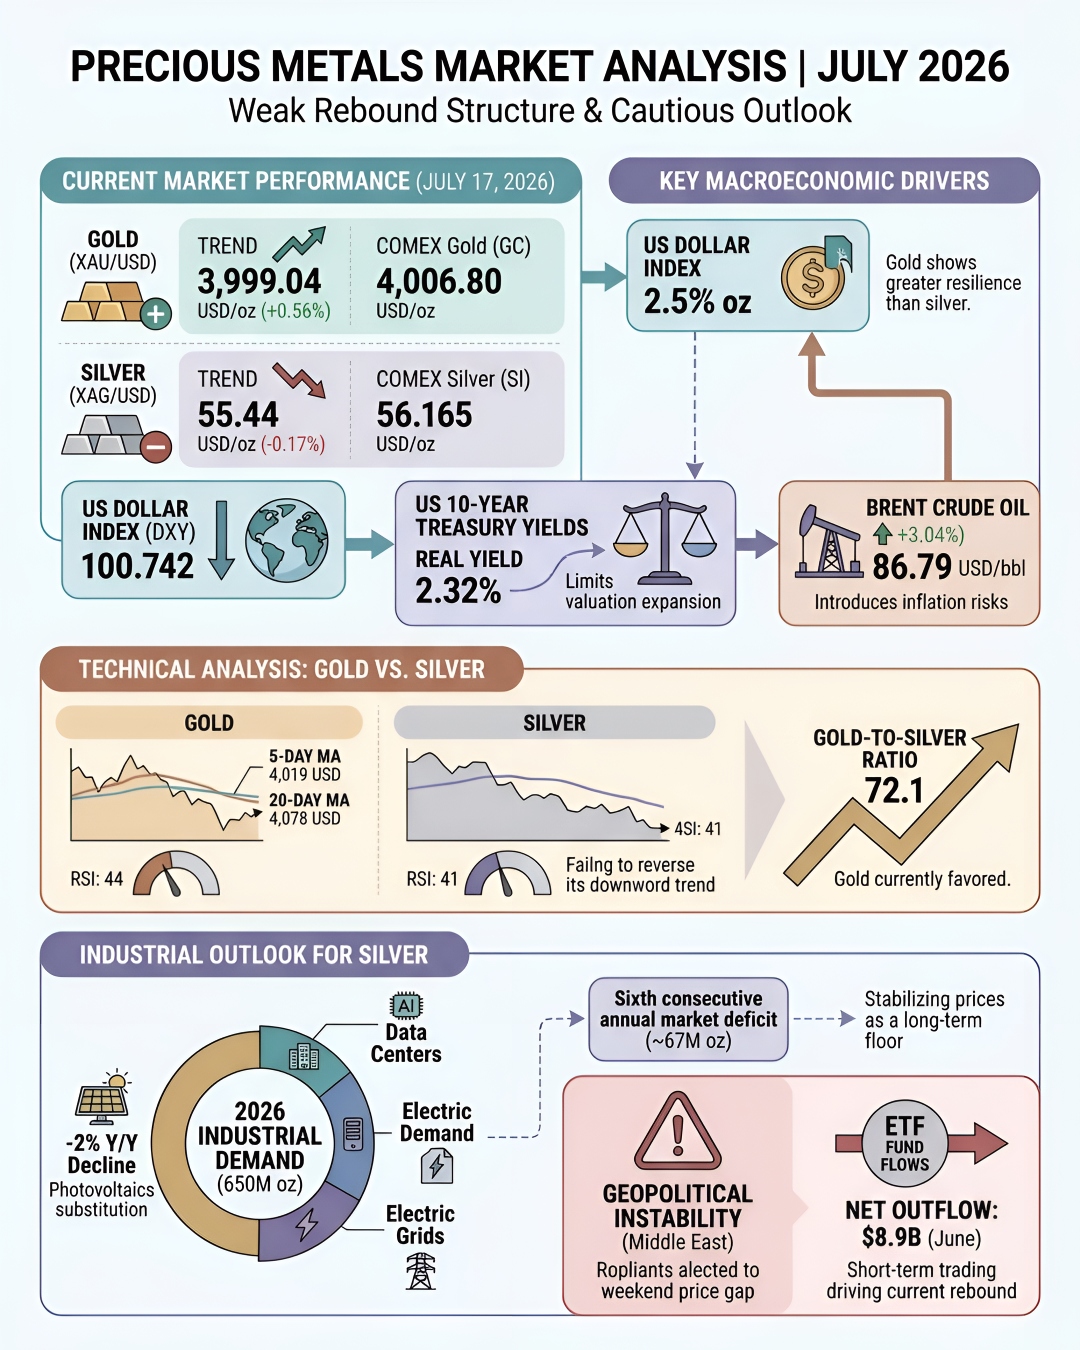
As of July 17, 2026, the precious metals market exhibits a weak rebound structure, with gold demonstrating greater resilience than silver. Gold prices are supported by cooling inflation, declining bond yields, and safe-haven demand, while silver faces headwinds from slowing industrial demand and technical weakness despite a structural supply deficit. The author maintains a cautious outlook, emphasizing that current price movements are corrective rather than a trend reversal. Investors are advised to monitor geopolitical risks in the Middle East and potential volatility over the weekend, as these factors could trigger significant price gaps upon market reopening. Strategic analysis indicates that gold remains the stronger asset, evidenced by a rising gold-to-silver ratio and more stable price action. Market participants should prioritize risk management, as current technical indicators suggest that both metals remain in a broader downward trend until key resistance levels are decisively breached. Practical application involves monitoring the 3,963 USD support level for gold and the 55.00 USD support level for silver. Traders should remain vigilant regarding real interest rates and the US Dollar Index (DXY), as these macro variables will dictate the sustainability of the current rebound.

Key Points

01

🔹 Current Market Performance (July 17, 2026)

Gold (XAU/USD) is trading at 3,999.04 USD/oz, up 0.56%, while COMEX Gold (GC) is at 4,006.80 USD/oz. Silver (XAG/USD) is at 55.44 USD/oz, down 0.17%, with COMEX Silver (SI) at 56.165 USD/oz. Gold shows stronger momentum, while silver remains under pressure from industrial demand concerns.

02

🔸 Macroeconomic Drivers

The US Dollar Index (DXY) is at 100.742. US 10-year Treasury yields are at 4.55% with a real yield of 2.32%, which limits the valuation expansion of non-yielding assets. Brent crude oil rose 3.04% to 86.79 USD/bbl, introducing inflation risks that provide medium-term support for gold but potential short-term pressure if real rates rise.

03

⭐ Technical Analysis: Gold vs. Silver

Gold (GC) is struggling below its 5-day (4,019 USD) and 20-day (4,078 USD) moving averages, with an RSI of 44. Silver (SI) shows a deeper decline with an RSI of 41, failing to reverse its downward trend of lower highs and lower lows. Gold is currently favored over silver due to the rising gold-to-silver ratio of 72.1.

04

📊 Industrial Outlook for Silver

The Silver Institute projects 2026 industrial demand at 650 million ounces, a 2% year-over-year decline due to substitution in photovoltaics. However, demand from AI data centers and electric grids supports a sixth consecutive annual market deficit of approximately 67 million ounces, providing a long-term floor for prices.

05

💡 Strategic Risk Assessment

The primary risk is geopolitical instability in the Middle East, which could cause price gaps during the weekend. Investors should note that ETF flows show a net outflow of 8.9 billion USD in June, suggesting that the current rebound is driven by short-term trading rather than a fundamental shift in long-term institutional sentiment.

Want to create your own mindmap?

Login to Neumap AI and start creating your own mindmaps!

Get Started